A biomechanical analysis of the individual techniques of the hammer throw finalists in the Seville Athletics World Championship 1999.
by M. Gutierrez, V.M. Soto, F.J. Rojas
© by IAAF
17:2; 15-26, 2002
The work presented consists of a biomechanical analysis of the individual techniques of the hammer throw finalists at the World Championships held in Seville, Spain in August 1999. Threedimensional photogrammetric techniques were used to enable the most significant variables determining the throw's efficacy to be analysed and, consequently, to establish the inter-relationships between them, so making it possible to deduce the thrower's individual technique. The initial temporal study analyses two consecutive phases, the penultimate turn and the last turn, as well as the double and single support stages. Reference is then made to certain variables relating to the positions and movements of the thrower-hammer system that are significant for the distance reached (azimuthal angles). Finally, the values are given for the most relevant variables affecting each turn plus the temporal factors, such as the radius of the turn, speed and the angular momentum of the hammer head.
Victor Manuel Soto works at the Department of Physical Education at the University of Grenada in Spain.
Introduction
The
hammer throw is characterised by
the complex spatial structure
of the
action, where to achieve
the maximum
final velocity of the
hammer it is necessary
to make two or three
preparatory swings of
the hammer followed by
three, four or five
turns, while simultaneously
the thrower
hammer system moves lineally across the throwing circle. All this is complicated further by the change in spatial orientation of the plane that defines the pathway of the hammer in each turn (Dapena, 1984, 1986). This fact, together with the relatively long time required to achieve the final hammer speed, makes it difficult to analyse the factors that influence the distance of the throw, so much so that various solutions are possible.
Taking into account the contributory factors which determine the distance of the throw, the tangential velocity of the hammer head at the moment of release (VtF) will be determined by the increase in speed of each turn, a rate of increase that is individual for each thrower (Bondarchuk, 1987). It should reach its maximum value at the instant that the thrower releases it, when the projection angle (0) will be determined by the inclination plane of the hammer in each turn, the
thrower's final action (Dapena, 1984, 1986) and the height of release (h), which depends on the thrower's anthropometric dimensions and the position adopted at the end of the throw. Bearing these factors in mind, an individualised analysis will show the variability in hammer throw technique.
The positions adopted by the thrower in each turn can be divided into two clearly differentiated phases: (a) double support, where both feet remain in contact with the ground, and (b) single support, where the thrower turns, keeping only one foot on the ground. Historically, special attention has been paid to these phases, based on the theory that the hammer can only be accelerated in the double support phase, as the thrower cannot actively influence hammer speed during the single support phase.
On the basis of this theory, coaches have sought to prolong the double support phase and, more particularly so, after the technical changes proposed by Bondarchuk (1979, 1987) which were largely responsible for the excellent results obtained by Soviet throwers over the past two decades. Moreover, the theory was apparently proved by the marked fluctuations in hammer speed in each turn, accelerating only in the double support phase and reducing perceptibly in the single support phase (Kuznetsov, 1985; Dapena, 1984, 1989 and Bondarchuk, 1987).
This theory has been questioned by Dapena (1984, 1986, 1989), who showed that it was possible to increase implement velocity during the single support phase. Our own conclusions lead us to assert that, at the very least, the thrower cannot influence hammer speed negatively, even when the thrower pulls the hammer towards the body, until it reaches the highest point of its trajectory, leading to a situation where the thrower moves rapidly in advance of the hammer. However, if the thrower gets too far in advance of the hammer head, an excessive torque of the line of the shoulders in relation to that of the hips can be produced, causing a reduction in the radius of the turn.
In dealing with the circular movement of the thrower-hammer system, the change in
the resultant angular momentum (HR) during the throw itself must be equal to the resultant momentum of force exercised by the thrower operating against the system. In this sense, the greater the rate of change in the angular momentum of the hammer about its axis of rotation, then the greater the momentum of force exercised by the thrower will be and this also applies to the internal forces that the thrower has to support. This increase in the angular momentum of the hammer affects other factors such as the average tangential velocity (vm) and the average radius of the turn in each phase (rm), which gives the equation E-1 that determines the angular momentum of the hammer (Dapena, 1978; Dapena and McDonald, 1989).
EQUATION E-1
HR = MM(rmXVm)
Where HR is the resultant angular momentum of the hammer about the rotation axis of the system, mm is the mass of the hammer, rm is the radius of the turn and vm is tangential velocity.
Knowledge of the values of the change in angular momentum of the hammer during the throw, as well as its tangential velocity about the rotation axis of the system and its radius of turn provides extremely relevant data when analysing throwing technique, especially when related to temporal data describing the action of the hammer during the phases of double and single support in each turn. Thus, different authors (Kuznetsov, 1965; Rolf-Gunter, 1979; Dapena, 1984 and Bondarchuk, 1987) have put special importance on the variation of hammer speed during these two phases, proving that in each turn velocity increases in the double support phase and tends to decrease in the single support phase.
Another factor of efficacy discussed in the literature is the hammer's plane of inclination to the horizontal, especially in the context of its effect on the angle of release (Dapena, 1984). The progressive inclination of the plane of motion causes the hammer to rotate about the horizontal axis, coinciding with the
bisection of the angle of the throwing area and of the throw itself. Therefore, for a righthanded thrower, there is a counter-clockwise rotation about the vertical axis and a second rotation of the hammer about the horizontal axis, visible as counter-clockwise from the frontal plane. The magnitude of this second rotation about the horizontal axis is related to the plane of inclination of the hammer and is a consequence of the application of momentum of force along this axis.
Turning next to the positions adopted by the thrower, some authors have paid much attention to the displacement of the thrower's centre of gravity (CG) across the throwing circle to try to understand the dynamics of the thrower-hammer system (Dapena, 1986). Certain goniometric variables can be considered significant for the dynamic interrelationships of the system, such as those of the knee of the leg that remains in the support position throughout the throw (Pozzo, 1987), and the angles of torque of the shoulders in relation to the hips.
The aim of the study was to collect data from the world's best performers for analysis in order to discover the factors or criteria of efficacy used to obtain the best results.
Materials and method
One throw was analysed of each of the top six finalists in the Men's hammer event
and the first seven (with the exception of the fifth placed) finalists in the Women's hammer event at the 1999 World Championships held in Seville. The four turns and the final phase of the throw were analysed in each case, except for Piskunov. He made five turns, and only the last four were filmed. Table 1 sets out the names, nationality, position, best throw in the Championship (Sev99-Result), year the distance achieved in the throw under analysis (Sev99-Analysis) and the best mark of the year (Season 98-99) achieved by each thrower.
A three-dimensional photogrammetric technique was used, filming the action with two Panasonic MS-5 video cameras (operating at 50 Hz), with a cube as a reference system for 20 points distributed in the throwing circle. After calculating the bidimensional coordinates of the 21 body landmarks from the 14 segments of the body and the centre of the hammer head and these coordinates at 100 Hz through quintic spline functions, the cameras were automatically synchronised using algorithms developed by Gutierrez and Martinez (2000). The theoretical basis for this synchronisation lies in knowing the error produced in reconstructing the spatial coordinates of a moving point through the DLT algorithms (Abdel-Aziz and Karara, 1971),
Table 1: Subjects analyzed in this study with the results obtained in Sevilla99 Championships (Sev99-Result), the event analysed (Sev99-Analysis) and their best performance during 98-99 season (Season 98-99).
|
Athlete |
Country |
Position |
Sev99-Result (m) |
Sev99-Analysis (m) |
Season 98-9 (m) |
|
WOMEN |
|||||
|
Mihaela Melinte |
ROM |
1 |
75.20 |
74.21 |
76.07 |
|
Olga Kuzenkova |
RUS |
2 |
72.56 |
72.56 |
74.30 |
|
Lisa Misipeka |
AMS |
3 |
65.02 |
65.02 |
67.00 |
|
Katalin DivOs |
HUN |
4 |
65.86 |
65.86 |
67.64 |
|
Lyudmila Gubkina |
BLR |
6 |
65.44 |
64.12 |
68.27 |
|
Simone Mathes |
GER |
7 |
64.93 |
64.93 |
67.13 |
|
MEN |
|||||
|
Karsten Kobs |
GER |
1 |
80.24 |
80.24 |
82.78 |
|
Zsolt Nemeth |
HUN |
2 |
79.05 |
79.05 |
81.56 |
|
Vladislav Piskunov |
UKR |
3 |
79.03 |
79.03 |
80.00 |
|
Tibor Gecsek |
HUN |
4 |
78.95 |
78.95 |
82.57 |
|
Andrey Skvaruk |
UKR |
5 |
78.80 |
78.80 |
80.75 |
|
Christos Polychroniou |
GRE |
6 |
78.31 |
78.31 |
79.83 |
from two bidimensional images that do not coincide in time. When there is temporal coincidence between these images, there must also be a theoretical coincidence between their subsequent projection on the digitised space and the points previously digitised.
A pair of time matched cameras were synchronised through the digitisation of the two images produced. The coordinates were smoothed using quintic splines (Wood and Jennings, 1979), and finally the threedimensional coordinates were expressed in terms of an inertial reference system R1 (attached to the ground). The Z axis was vertical; the Y axis was horizontal, bisecting the throwing sector, and in the theoretical direction of the throw, while the X axis was perpendicular to the other two, using DLT algorithms for this purpose.
Segmental masses and the centre of mass locations were used to calculate the thrower's CG, as proposed by Zatsiorsky and Seluyanov (1985) and adapted by de Leva (1996). The algorithms described by Dapena (1986) were used to calculate the threedimensional coordinates of the CG of the thrower-hammer system (CGs). Once the CGs was calculated, the linear regression of its coordinate X to Y was obtained in order to know the angle between the direction of the straight line of the regression obtained that represents the direction of the displacement of the CGs across the throwing circle and the bisection of the throwing sector. This angle is used to make both directions coincide by using a rotation matrix of the three-dimensional coordinates through the vertical axis, obtaining new three-dimensional coordinates of an inertial reference system (R2). This provides for a comparison of the azimuthal angles among the various throwers.
Based on the methodology suggested by Dapena (1984), a low frequency digital filter was applied to the X and Y coordinates of the CGs obtained from the inertial reference system R2. This was done with the aim of smoothing the fluctuations produced by the CGs in these coordinates, while the Z coordinates of the CGs were not
filtered to avoid unduly influencing the plane of inclination of the hammer. A quasi-inertial reference system (R3) was used for the three-dimensional coordinates; it cannot be considered inertial since some fluctuations in its origin remained. In this way the R3 reference system was displaced with CGs throughout the throw, maintaining certain fluctuations, above all in axis Z.
We have made a distinction between the turn and the swing or gyration, so that the different throwing techniques could be compared. The turn is the movement of the thrower's lower limbs from the beginning of one single support phase to the beginning of the next single support phase and can be more or less than 3600. The gyration is the path of the hammer head as it moves through the full rotation of 360°. The word 'phase' is used for each part i.e. single support phase or double support phase, that makes up the turn.
To understand the displacement of the hammer during the double and single support phases, the concept of the azimuthal angle has been used, as introduced by Samozvetov (1971). This enables the throw to be observed from overhead with a graduated circumference where the direction 0180° coincides with the bisection of the angle which defines the throwing sector, as well as the theoretical direction of the displacement of CGs according to the coordinates of the R2 reference system.
To calculate the average radius of the turn in each of its single and double support
phases, (rm(p)) the pathway of the hammer
must be divided, using the R3 reference system, in arcs of circular sectors (cycloid curves), relating the displacement of the hammer to known time intervals (Dt= 0.02 s). Using the coordinates of the hammer head in the initial position (t(n_1)= 0, position
Xn_1, Yn_1 and Zn-1), the intermediate position (t(n)=0.01, position Xn, Yn, Zn) and the final position (t(n+1)= 0.02, position Xn+1• Yn+1 and Zn+1) of each sector, it is possible to calculate the angle of the vectors that define its displacement, as set out in the following equation E-2.
EQUATION E-2
r = { (x„-1 - Xn), (y.-1 - Yn), (Zn_1 - Zn)
q = { (Xn+1 - Xn), (Yn+1 - Yn), (Z-.,l - Zn))
cos h=(r•q)(IrI-IgI)-I
Where r and q are the vectors which define the displacement of the hammer at intervals of 0.02 sec., B is the angle between these vectors and (Xn_1, Yn_1, Zn-1, Xn, Yn, Zn) and (Xn+1, Yn+1, Zn+1)• the three-dimensional coordinates of the initial, intermediate and final positions of the arc of the circular sector respectively.
With angle B known, and bearing in mind that the radius of the turn of the arc of the circular sector forms a right angle to vectors r and q, the angle of displacement (y) is 180B, so that it is possible to discover the average angular velocity (wm) in the 0.01 time interval, as well as the average radius of the turn of the arc through the quotient between average tangential velocity (vm) and the average angular velocity (wm) of the arc. Finally, the average radius during each phase
of the turn (rm(p)) corresponds to the average
radius of all the sectors which determine these phases, while the radius of a complete
gyration (rm((3() corresponds to the average
radius of all the sectors which determine a complete gyration.
To calculate the resultant angular momen
tum of the hammer head in each phase HR(P), and each gyration HR((3) the equations E-3 are
used, where the data of the average angular velocity developed during the time of each
phase of the turn (wm(p)) corresponds to the
average angular velocity of all the arcs which determine the temporal periods described for the calculation of the average radius of gyration in each phase. The angular velocity of
one complete gyration (wm((3)) corresponds to
the average angular velocity of all the sectors that make up one complete gyration.
EQUATION E-3
HR(p) = m rm(P)2 Wm(P)
HR(6) = m rm(G)2 Wm((i)
Where HR(P) and HR(G) are the average
angular momentum of the hammer head in each phase and gyration respectively, m
the official mass of the hammer, rm(P) and rm(G) the average radius of the hammer in each phase and gyration respectively, Wm(P) and wm(G) the average angular velocities of each phase and gyration respectively.
Results
Table 2 sets out the times that correspond to the double support (DS) and single support (SS) phases in each turn for both men and
Table 2: Temporal analysis of the single (5S) and double (DS) support phases in each turn (T1, T2, T3, T4), at release, total time of the throw, and gyrations (G1, G2, G3, G4).
|
ATHLETE |
Phases in each turn (s) |
Gyration (s) |
|||||||||||
|
SS,T1 |
DS,T1 |
SS,T2 |
DS,T2 |
SS,T3 |
DS,T3 |
SS,T4 |
Release |
Total |
G1 |
G2 |
G3 |
G4 |
|
|
WOMEN |
|||||||||||||
|
Mihaela Melinte |
0.36 |
0.33 |
0.25 |
0.25 |
0.25 |
0.18 |
0.26 |
0 24 |
2.12 |
0.61 |
0.52 |
0.47 |
0.44 |
|
Olga Kuzenkova |
0.28 |
0.37 |
0.27 |
0.24 |
0.26 |
0.23 |
0.24 |
0.26 |
2.15 |
0.71 |
0.53 |
0.47 |
0.43 |
|
Lisa Misipeka |
0.34 |
0.41 |
0.27 |
0.29 |
0.23 |
0.23 |
0.26 |
0.26 |
2.29 |
0.71 |
0.59 |
0.51 |
0.45 |
|
Katalin Div6s |
0.32 |
0.32 |
0.28 |
0.22 |
0.30 |
0.22 |
0.30 |
0.27 |
2.23 |
0.68 |
0.53 |
0.48 |
0.47 |
|
Lyudmila Gubkina |
0.26 |
035 |
0.26 |
0.25 |
0.27 |
0.21 |
0.27 |
0.24 |
2.11 |
0.64 |
0.52 |
0.48 |
0.44 |
|
Simone Mathes |
0.30 |
0.36 |
0.26 |
0.24 |
0.26 |
0.22 |
0.26 |
0.20 |
2.10 |
0.67 |
0.53 |
0.45 |
0.44 |
|
MEN |
|||||||||||||
|
Karsten Kobs |
0.30 |
0.30 |
0.28 |
0.22 |
0.28 |
0.18 |
0.28 |
0.23 |
2.07 |
0.62 |
0.49 |
0.44 |
0.42 |
|
Zsolt Nemeth |
0.32 |
0.32 |
0.28 |
0.21 |
0.25 |
0.17 |
0.27 |
0.24 |
2.06 |
0.66 |
0.51 |
0.43 |
0.41 |
|
VladislavPi5kunov |
0.27 |
0.21 |
028 |
0.17 |
0.22 |
0.20 |
0.21 |
025 |
181 |
0.51 |
0.44 |
0.42 |
0.40 |
|
Tibor Gecsek |
0.30 |
0.34 |
0.26 |
0.26 |
0.20 |
0.24 |
0.22 |
0.25 |
2.07 |
0.67 |
0.52 |
0.45 |
0.42 |
|
Andrey Skvaruk |
0.32 |
0.57 |
0.29 |
0.26 |
0.27 |
0.20 |
0.28 |
0.20 |
2 39 |
0.89 |
0.58 |
0.45 |
0 42 |
|
Christos Polychroniou |
0.28 |
0 34 |
0.24 |
0.26 |
0.22 |
0.22 |
0.22 |
0.26 |
2.04 |
0.60 |
0.48 |
0.45 |
0.42 |
women. According to the reasoning of Kriwonossov (1972) and Bondarchuk (1979), the double support phase of each turn should last as long as possible. However the variations shown by the temporal results make it impossible to confirm this fact empirically. Analysing the women's results, Misipika is the only thrower who had a double support period equal to or greater than the single support phase in each turn, while the contrary occurred with Melinte. Although Kuzenkova took a higher average time for the double support phase than for the single, this was only in the first and final turns. With the men there was a considerable variation in the times, so that while Gecsek and Polychroniou took more time for the double than for the single support phase in each turn, Kobs and Nemeth never achieved this and Shvaruk only did so during the first turn.
Table 2 presents the times taken by the hammer to complete a full gyration of 3600. It can be seen that in all cases there is a reduction in time for each gyration according to the particular rhythm of each thrower, although all of them take similar times in the third gyration, between 0.42s and 0.45s for men, and between 0.45s and 0.51s for women. During the fourth gyration the reduction in time stabilises at between 0.02s and 0.03s for men and between 0.03 and 0.06 for women. A comparison of the data for women and men shows that in every case men turn more rapidly than women in the last two turns.
Table 3 uses the data obtained from reference system R3 to present the azimuthal angles of the positions of the hammer at the beginning and end of the double support phase in each turn where the bisection of the angle of the throwing area corresponds to
Figure 1: Azimuthal angles of the positions of the hammer at the beginning and end of the double support phase in each turn.
Table 3: Azimuthal angles (°) at the end of each single (SS) and double (DS) support phases in each turn and at release.
|
Athlete |
DS1 |
SS1 |
DS2 |
SS2 |
DS3 |
SS3 |
DS4 |
SS4 |
Release |
|
WOMEN |
|||||||||
|
Mihaela Melinte |
49 |
242 |
99 |
264 |
93 |
277 |
70 |
277 |
129 |
|
Olga Kuzenkova |
115 |
237 |
86 |
249 |
66 |
252 |
78 |
263 |
126 |
|
Lisa Misipeka |
86 |
238 |
112 |
259 |
97 |
248 |
63 |
250 |
108 |
|
Katalin DivOs |
73 |
221 |
53 |
223 |
23 |
237 |
52 |
268 |
130 |
|
Lyudmila Gubkina |
107 |
242 |
94 |
263 |
86 |
276 |
84 |
284 |
128 |
|
Simone Mathes |
90 |
240 |
89 |
252 |
72 |
263 |
85 |
283 |
102 |
|
MEN |
|||||||||
|
Karsten Kobs |
49 |
204 |
41 |
234 |
48 |
265 |
63 |
288 |
135 |
|
Zsolt Nemeth |
50 |
203 |
43 |
230 |
34 |
232 |
17 |
245 |
90 |
|
Vladislav Piskunov |
71 |
250 |
52 |
269 |
58 |
243 |
58 |
242 |
105 |
|
Tibor Gecsek |
88 |
232 |
76 |
240 |
74 |
227 |
66 |
234 |
102 |
|
Andrey Skvaruk |
62 |
170 |
63 |
226 |
43 |
249 |
56 |
287 |
114 |
|
Christos Polychroniou |
30 |
184 |
44 |
221 |
61 |
239 |
63 |
248 |
110 |
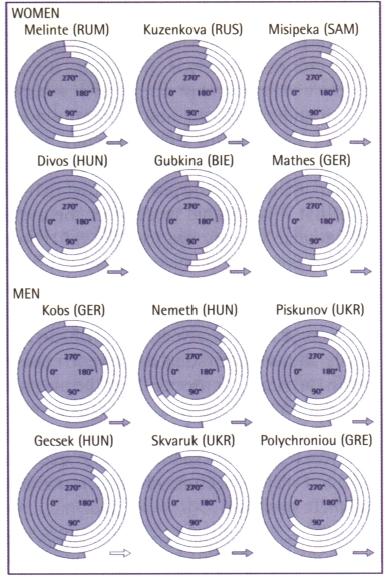
1800. The graph representing the displacement of the hammer during the phases of single and double support from the azimuthal angle is set out in Figure 1, which completes the information given in table 3.
According to the logic of the explanation given by Kriwonossov (1972) and Bondarchuk (1979), it is necessary to initiate the single support phase at an azimuthal angle of 90° or more, and to initiate the double support phase at an angle close to 250° or less, which increases the displacement of the hammer during the double support phase. The data available reveals that both Piskunov and Gecsek throughout the throw maintained an action which justified this theory while, Kobs among the men, and Melinte and Gubkina among the women began the double support phase later in each turn. As a result, these three throwers reduced the displacement of the hammer during the double support phase. The variability of the data leads to the conclusion that the amplitude of the hammer's displacement during the double support phase cannot be considered, just by itself, as a particularly relevant factor in the distance of the throw, although it is possibly associated with the relationship between other factors such as the radius of the turn, angular velocity or the possibility of continuing to apply the momentum of force in certain positions.
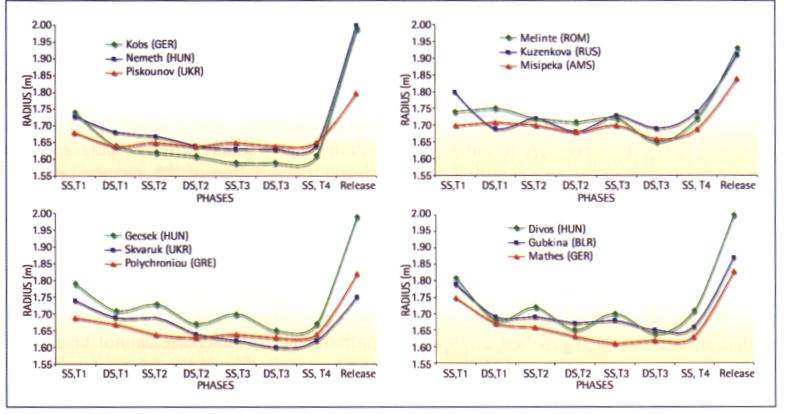
Table 4 sets out the data of the average
radius of the hammer (rr,(P)) during the dou
ble and single support phases, as well as the
average radius of each gyration (rr,(G)), not
ing some tendency to increase the radius during the single support phase, especially by Gecsek, Kuzenkova and Divos. This point is highlighted in graph form in Figure 2, which shows the variation of the average radius in each phase. It can be seen that there is an increase in the radius during the final phase because the thrower, at the end of that stage (from the lowest position of the hammer to the release), follows the hammer, moving the arms and trunk along the hammer release path. In fact this increase cannot be seen in the average radius of the fourth turn, where there are no increases in the average radius of the final period. The average radius in
each gyration (rm((3)) presents a slight gener
al reduction, men obtaining reductions of -0.04 m between the first and second gyration, -0.02 m between the second and third, and -0.01 m between the third and fourth. Women reduced their average radius by 0.05 m between the first and second gyration, maintaining a constant value during the others. Among the men Kobs is a special case, being the only one to manage to increase the radius in the fourth gyration, although he was also one of those who had most reduced the radius during the previous gyrations.
Table 4: Average Radius of Rotation (m) of the hammer in each phase of the turn and gyration.
|
ATHLETE |
Radius in each phase of the turn (r,,,()) |
Radius in each gyration (r0,(c)) |
||||||||||
|
SS,T1 |
DS,T1 |
SS,T2 |
DS,T2 |
SS,T3 |
DS,T3 |
SS,T4 |
Release |
1 |
3 |
4 |
||
|
WOMEN |
||||||||||||
|
Mihaela Melinte |
1.74 |
1.75 |
1.72 |
1.71 |
1.72 |
1.65 |
1.72 |
1.93 |
1.74 |
1.72 |
1.70 |
1.69 |
|
Olga Kuzenkova |
1.80 |
1.69 |
1.72 |
1.68 |
1.73 |
1.69 |
1.74 |
1.91 |
1.74 |
1.70 |
1.71 |
1.78 |
|
Lisa Misipeka |
1 70 |
1.71 |
1.70 |
1.68 |
1.70 |
1.66 |
1.69 |
1.84 |
1.70 |
1 69 |
1 69 |
1.67 |
|
Katalin Div6s |
1.81 |
1.68 |
1.72 |
1 65 |
1.70 |
1.64 |
1 71 |
2.00 |
1.75 |
1.68 |
1.68 |
1.68 |
|
Lyudmila Gubkina |
1 79 |
1.69 |
1.69 |
1.67 |
1.68 |
1.65 |
1.66 |
1.87 |
1.73 |
1.67 |
1.66 |
1.66 |
|
Simone Mathes |
1.75 |
1.67 |
1.66 |
1.63 |
1.61 |
1 62 |
1 63 |
1.83 |
1.71 |
1.64 |
1.62 |
1.68 |
|
MEN |
||||||||||||
|
Karsten Kobs |
1.74 |
1.64 |
1.62 |
1.61 |
1.59 |
1.59 |
1.61 |
1.99 |
1.69 |
1.62 |
1.59 |
1.61 |
|
Zsolt Nemeth |
1.73 |
1.68 |
1.67 |
1.64 |
1.63 |
1.63 |
1.64 |
2.00 |
1.70 |
1 65 |
1.63 |
1.63 |
|
Vladislav Piskunov |
1.68 |
1.64 |
1.65 |
1.64 |
1.65 |
1.64 |
1.65 |
1.80 |
1 66 |
1 65 |
1.64 |
1.64 |
|
Tibor Gecsek |
1.79 |
1.71 |
1.73 |
1.67 |
1.70 |
1.65 |
1.67 |
1.99 |
1.74 |
1.70 |
1.68 |
1.76 |
|
Andrey Skvaruk |
1.74 |
1.69 |
1.69 |
1.64 |
1.62 |
1.60 |
1.62 |
1.75 |
1.71 |
1.67 |
1.61 |
1.60 |
|
Christos Polychroniou |
1.69 |
1.67 |
1.64 |
1.63 |
1.64 |
1.63 |
1.64 |
1.82 |
1.67 |
1.65 |
1.64 |
1.62 |
When the variable radius of the gyration is considered in isolation, its maximum values must be maintained in each gyration, since theoretically, the thrower who, for a given angular velocity achieves a greater radius for the gyration, will also achieve greater tangential velocity. However, looking at the values produced, Kobs had the smallest average radius of gyration of all the throwers analysed (1.63 m), especially in the third
gyration (1.59 m). This fact, together with the
individual variability reflected in the data,
suggests that this factor by itself must not be overstated as an exclusive criterion of efficacy in the throw (within the varying data, as the average of all the gyrations, between 1.63 m and 1.70 m for men, and between 1.66 m and 1.72 m for women). In contrast, Kuzenkova achieved the greatest average radius in the third gyration, even better than that of the men, keeping the radius almost constant during all the gyrations.
Table 5 shows the data of the resultant angular momentum of the hammer, devel
Table 5: Average Angular Momentum (Kgm's') of the hammer in each phase of the turn and gyration.
|
ATHLETE |
Angular momentum in each phase of the turn |
Angular mornentumin each gyration |
||||||||||
|
SS,T1 |
DS,T1 |
SS,T2 |
DS,T2 |
SS,T3 |
DS,T3 |
SS,T4 |
Release |
1 |
2 |
3 |
4 |
|
|
WOMEN |
||||||||||||
|
Mihaela Melinte |
11540 |
136.09 |
136.89 |
149.92 |
152 21 |
157.27 |
164.41 |
203.32 |
124.50 |
142.10 |
154.97 |
165.27 |
|
Olga Kuzenkova |
97.17 |
111.28 |
125.83 |
140.92 |
149.59 |
158.13 |
164.22 |
200.48 |
106.97 |
136.65 |
155.96 |
178.43 |
|
Lisa Misipeka |
95.34 |
112.83 |
114.23 |
130.69 |
131 52 |
143.41 |
143 08 |
181.80 |
103.83 |
122.77 |
138.99 |
152.47 |
|
Katalin Div6s |
104.75 |
116.15 |
125.40 |
137.88 |
141.34 |
148.09 |
149.43 |
196.29 |
111.99 |
132.92 |
145.23 |
151.69 |
|
Lyudmila Gubkina |
112.33 |
121.26 |
128.98 |
139.90 |
139.07 |
146.04 |
145.78 |
181.82 |
118.50 |
134.46 |
142.62 |
152.93 |
|
Simone Mathes |
105.96 |
113 53 |
120.00 |
133.95 |
136.41 |
149.09 |
147.21 |
181.57 |
110.33 |
127 66 |
143 19 |
158.18 |
|
MEN |
||||||||||||
|
Karsten Kobs |
197.67 |
219.22 |
231.00 |
252.16 |
252.18 |
270.61 |
270.78 |
371.77 |
209.58 |
241 58 |
259.19 |
275.04 |
|
Zsolt Nemeth |
185.49 |
214.72 |
239.65 |
259.23 |
268.69 |
282 68 |
286.75 |
397.81 |
201.27 |
249.64 |
276.33 |
291.64 |
|
Vladislav Piskunov |
237.14 |
257.24 |
271.25 |
287.24 |
288.56 |
294.88 |
299.92 |
338.98 |
247.54 |
279.33 |
292.01 |
303.36 |
|
Tibor Gecsek |
192.72 |
216 58 |
240.96 |
261.43 |
273.92 |
286.06 |
290.75 |
369.37 |
206.81 |
254.02 |
283.66 |
316.10 |
|
Andrey Skvaruk |
131.21 |
158.38 |
199.97 |
229.06 |
248.05 |
270.03 |
275 66 |
329 18 |
148.83 |
215.77 |
25840 |
280.12 |
|
Christos Polychroniou |
195.77 |
223.17 |
244.34 |
260.59 |
269.66 |
280.54 |
283 19 |
332.04 |
208.59 |
252.20 |
274.22 |
285.82 |
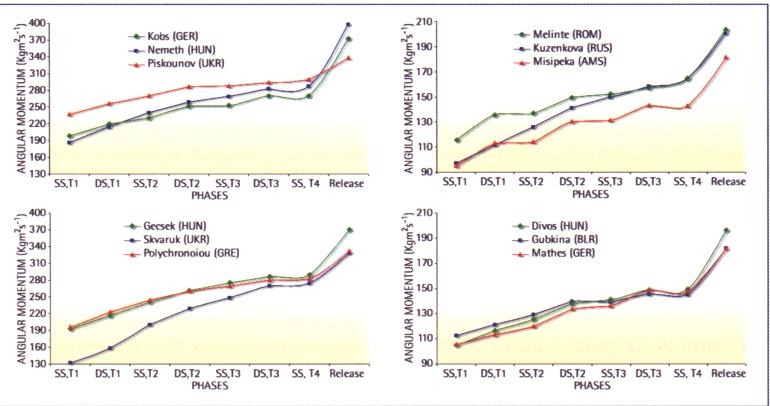
oped during each turn (HR(P)) and each gyration (HR(G)), showing a certain tendency for it
to increase more in the double and less in the single support phase, in contrast to what occurs with the radius of the average gyration. Therefore, the increase in angular momentum in the double support phase corresponds to the increase in angular velocity and not the radius of the gyration. This is shown in the graph in Figure 3 which highlights the variation in the average angular momentum for each turn and gyration. Interestingly, Kobs produced relatively low values for both angular momentum and radius. This fact is possibly connected to the reduced displacement by the hammer during the double support phase, as can be deduced from the data presented in Table 3 and the graph in Figure 1. Equally, the increase in the values of the angular momentum of the hammer during the final phase of the throw must be related to the long distance Kobs covered in the double support phase, as he finished the throw with values above 371 Kgm2s'.
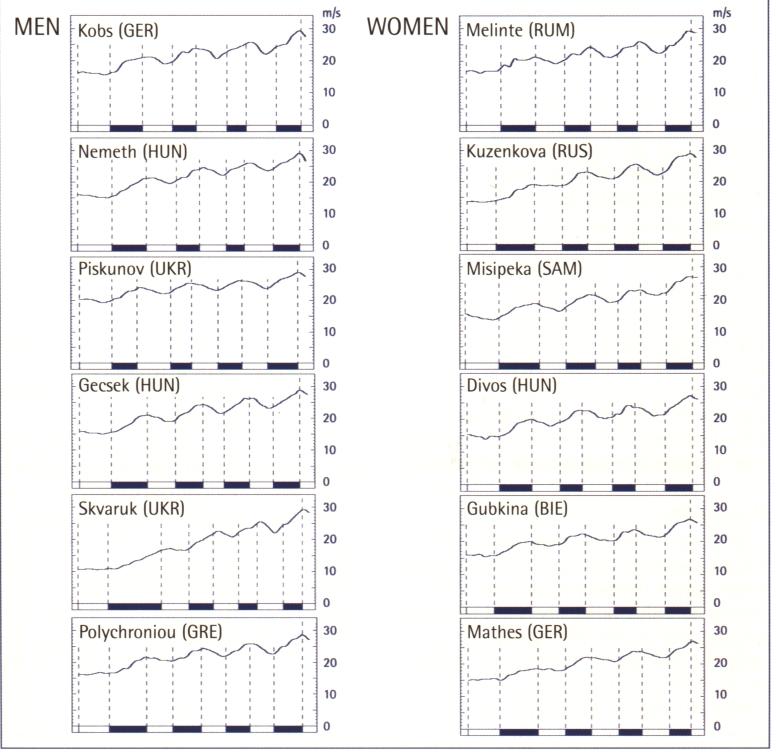
Figure 4 is the graph showing the tangential velocity of the hammer, verifying the existence of the oscillations described by Kuznetsov (1965), Dapena (1984) and Bondarchuk (1987), where there is a tendency to increase velocity during the double support phase and to reduce it in the single support phase. The behaviour of velocity during the final phase must be highlighted, since a progressive increase was to be expected as a consequence of being in the double support phase with a progressive elevation of CGs. However, the fact is that in spite of the average velocity increasing during this period, in almost all cases there is either no increase or even a slight fall in velocity in this final phase.
Discussion
From the results obtained, the existence of some variability in the data can be deduced, albeit within limits that can be considered normal, and this variability is not related to the distance of the throw. Thus, it can be seen that Mathes achieves a faster gyration in the third gyration (0.45 s), while Melinte, although slower (0.47 s), nevertheless achieves a throw of 9.28 m further. Looking
at the azimuthal angles and the radius of the turn, Gecsek was the athlete who began the double support phase of the third turn (227°) earliest and maintained the greatest average radius of gyration (1.68 m), while Kobs started the double support phase of the third turn very late (265°) and with a smaller average radius of gyration (1.59 m), and yet won the world title.
Another relevant aspect revealed by the data is the fact that there are no differences between women and men in such matters as azimuthal angles and radius of the turn. This is probably connected to the difference in mass of the hammers; the greater mass of the men's hammer causes the thrower's CG to be further behind the hammer head than for women, with the effect of reducing the radius of the latter, but the longer arms of the men compensate for this. The only clear difference found was the time taken for each gyration, as the men, in all cases, were faster than the women in the last two gyrations.
Basing ourselves on Bondarchuk's theories (1979, 1987), which are widely accepted by the majority of hammer coaches, the thrower should prolong the double support phase in each turn, with the aim of adopting the right positions to produce a certain momentum of force which allows the rate of angular momentum of the hammer about the vertical axis to be increased. However, the data collected does not fully confirm this theory and, in Figure 1, it is seen that most throwers initiate the double support phase later and later, with a tendency to reduce the distance travelled by the hammer during the double support phase in each turn.
The data set out in Table 5 explains this point by showing that the average resultant angular momentum of the hammer increases relatively little after the double support phase in the second turn (138.87 Kgm's-' and 258.28 Kgm's-' as average figures for men and women throwers respectively). This presupposes that, starting with the second turn, until the beginning of the final phase, the variation in the angular momentum of the hammer is very small (13.97 Kgm's-' and 26.22 Kgm's-' as average figures for men and women throwers respectively). The conse-
quence is that if throwers do not need to increase the rate of the angular momentum as of the second turn onwards, they will not need to increase substantially the distance travelled by the hammer during the following double support phase.
Finally, we must point out the importance of the final phase for the distance of the throw and especially the increase produced in the resultant angular momentum. Table 5 shows an average increase of 38.03 Kgm's' by women and of 72.02 Kg m2s' for men. Kobs was outstanding, since in spite of beginning the double support phase later, he produced during the last phase a variation of angular momentum of 100.99 Kg m2s-' as a consequence of a progressive elevation of the CGs that allowed him to release the hammer at a height of over 1.90 m with the trunk and arms following the throw.
Analysing the variability of the results confirms that hammer throw technique is the consequence of the interaction of several factors or individual criteria of efficacy, consistent with the individual resolution of
References
ABDEL-AZIZ,Y.I. AND KARARA,H.M. (1971). Direct linear transformation from comparator coordinates into object space coordinates in close-range photogrammetry. Proc. ASP/U1 Symp. Close-Range Photogrammetry, Urbana, Illinois. Falls Church, V.A: American Society of Photogrammetry, 1-18.
BONDARCHUK,A.P. (1979). Die moderne technik bein hammerwerfen. Leichtathletic, Osterreich, 2, 3, 22-23.
BONDARCHUK,A.P. (1987). La tecnica moderna en el lanzamiento de martillo. Cuadernos de Atletismo, 20. Escuela Nacional de Entrenadores, Madrid.
DAPENA,J. (1978). A method to determine the angular momentum of a human body about three orthogonal exes passing through its centre of gravity. Journal of Biomechanics. 11, 251-256.
DAPENA,J. (1984). The pattern of hammer speed during a hammer throw and influence
the interconnections between these factors. For this reason, we have preferred to focus our discussion on this interaction rather than limit it to a restricted vision of each factor. Isolated factors, within certain margins, are not too important; it is their interrelationship which is truly relevant.
This study was financed by the General Subdepartment for Scientific and Technical Research of CICYT through a "Special Action" for the Seville Athletics World Championships of 1999.
Contact:
Victor Manuel Soto
Dpto. Educacion Fisica y Deportiva, Universidad de Granada carretera Alfacar, s/n, 18011, Granada, SPAIN
e-mail: vitorioe@a.teleline.es
vsoto@a.ugr.es
of gravity on its fluctuations. Journal of Biomechanics. 17, 8, 553-559.
DAPENA,J. (1986). A kinematic study of centre of mass motion in the hammer throw. Journal of Biomechanics. 19, 2, 147-158.
DAPENA,J. (1989). Influence of direction of the cable force and of the radius of the hammer path on speed fluctuations during hammer throwing. Journal of Biomechanics. 22, 6, 565-575.
DAPENA,J. AND MCDONALD,G. (1989). A threedimensional analysis of angular momentum in the hammer throw. Medicine and Science in Sports and Exercise. 21, 2, 206-220.
GUTIERREZ,M. AND MARTINEZ,J.M. (2000). Metodo matematico para la sincronizacion de las camaras mediante la utilizacidn de los algoritmos DLT. Biomecanica. Edicion Iberica, VII, 13, 65-72.
KUZNETSOV,V. (1965). Path and speed of the hammer in the turns. Legk. Atletika. 11, 11-12.
KRIwoNOSSOV,M. (1972). J. Gamski throws the hammer. Yessis Review, 7, 4, 65-99.
LEVA,P.DE (1996). Adjustments to ZatsiorskySeluyanov's segment inertia parameters. Journal of Biomechanics. 29, 9, 12231230.
Pozzo,R. (1987). Metodi biomeccanici nell'alenamiento del lancio del martelo. Aspectti sui processi informativi. Atleticastudi. 4, 219-234.
ROLF-GUNTER,J. (1979). Velocity in hammer throwing. Track Technique. 77, 2449-2450.
Samozvetov,A. (1971). The acceleration of the hammer. Legkaya Atletika. 11, 18-20.
TSCHIENE,P. (1980). Nuevos elementos en la tecnica del lanzamiento de martillo. Cuadernos de atletismo, 3. Escuela Nacional de Entrenadores, Madrid.
WOOD,G.A. AND JENNINGS,L.S. (1979). On the use of spline functions for data smoothing. Journal of Biomechanics. 12, 477-479.
ZATSIORSKY,V.M. AND SELUYANOV,V. (1985). Estimation of the mass and inertia characteristics of the human body by means of the best predictive regressions equations. Biomechanics IX-B, (edited by Winter,D. et al.) 233-239, Human Kinetics Publishers, Champaign, Illinois.